What if you were to suddenly learn your option trading strategy had always been missing one of its three core components? For most of us it could be a jarring wake-up call, if we believed it at all.
Well, buckle up — odds are your bottom line could have been even bigger if you’d considered one more detail the whole time you’ve been trading. That detail is time.
But, first things first.
Perhaps without even realizing it, most traders already have a good grip on two critical trading skillsets. Those are direction, and distance. That is to say, we know trading requires an understanding of which direction a stock or the broad market is headed next. And, we also have a reasonably good idea of how far an index or a stock might move. The latter of these two nuances helps us set realistic profit targets, and in some cases helps us determine how or what we’re going to trade; that’s particularly important for options traders. And if you’ve made more money than you’ve lost by mastering these ideas, you’re doing fine.
There’s a third leg of trading wisdom, however, related to the first two even if it’s not quite like them. That’s time. How long will it take a chart to move from point A to point B? Or, perhaps voiced in a different way, how far can a chart move between now and then?
This is where things get tricky. Sometimes traders can figure out (more or less) direction and distance. What’s not always clear is how long traders should give a trade to pan out.
The secret is pre-determining how long you’re going to hold a trade before you even step into it.
That sounds crazy… at first. Even if you’re making accurate calls about a chart’s next direction and pinpointing where a new or existing trend will come to a close, unexpected things happen every day. Pulling the plug on a trade before you clearly have to feels like the wrong move. It also goes against the grain of what’s generally offered as sound trading advice.
Here’s the detail that’s so often forgotten though, if it’s ever realized at all — most great trades are winners right from the start. In fact, the best of the best trades reach their maximum payoff potential shortly after they’re entered. At the same time, many of the ones that get a slow start don’t end up paying off at all.
Moral of the story? Good or bad, don’t let ‘em linger.
So what’s the right holding period for an option trade? Obviously it depends on the trader and the underlying strategy he or she is using. Here at 2-Day Trader though, the ideal holding period is an unsurprising two trading days. A position that’s opened on a Tuesday is closed out on a Thursday. A new option trade taken on Friday is exited the following Tuesday. You get the ideas.
It’s the approach we use mostly because it works. Of course, it works for us because that’s the best time-based exit based on our specific trade-selection regimen.
While the details of our system are proprietary, the particulars of our approach aren’t a secret. We prefer options that are right at-the-money (strike prices very close to the underlying stock’s current price) and expiring between seven and eleven days from the point where we pull the trigger. Buying any more time reduces the responsiveness of the option. Ditto for moving to deeper-in-the-money options as well as moving to more out-of-the-money options.
These at-the-money options deliver a little — or even a lot — more leverage than many traders tend to plug into. In turn. this approach effectively requires our directional calls to be “right” a lot more often than not, and with a two-day holding period, we have to be right in a hurry, catching reversals even before they clearly take shape; waiting for a momentum indicator to trigger a trade would take way too long. That’s why our trading system is instead rooted in the shape of a chart’s daily bars… candlestick analysis, as some call it, since a stock chart’s bars often look like variously-shaped candlesticks.
There’s a lot of great information to be gleaned from just these seemingly-simple chart patterns though, which is why our average two-day winning option trade results in an 85.3% gain.
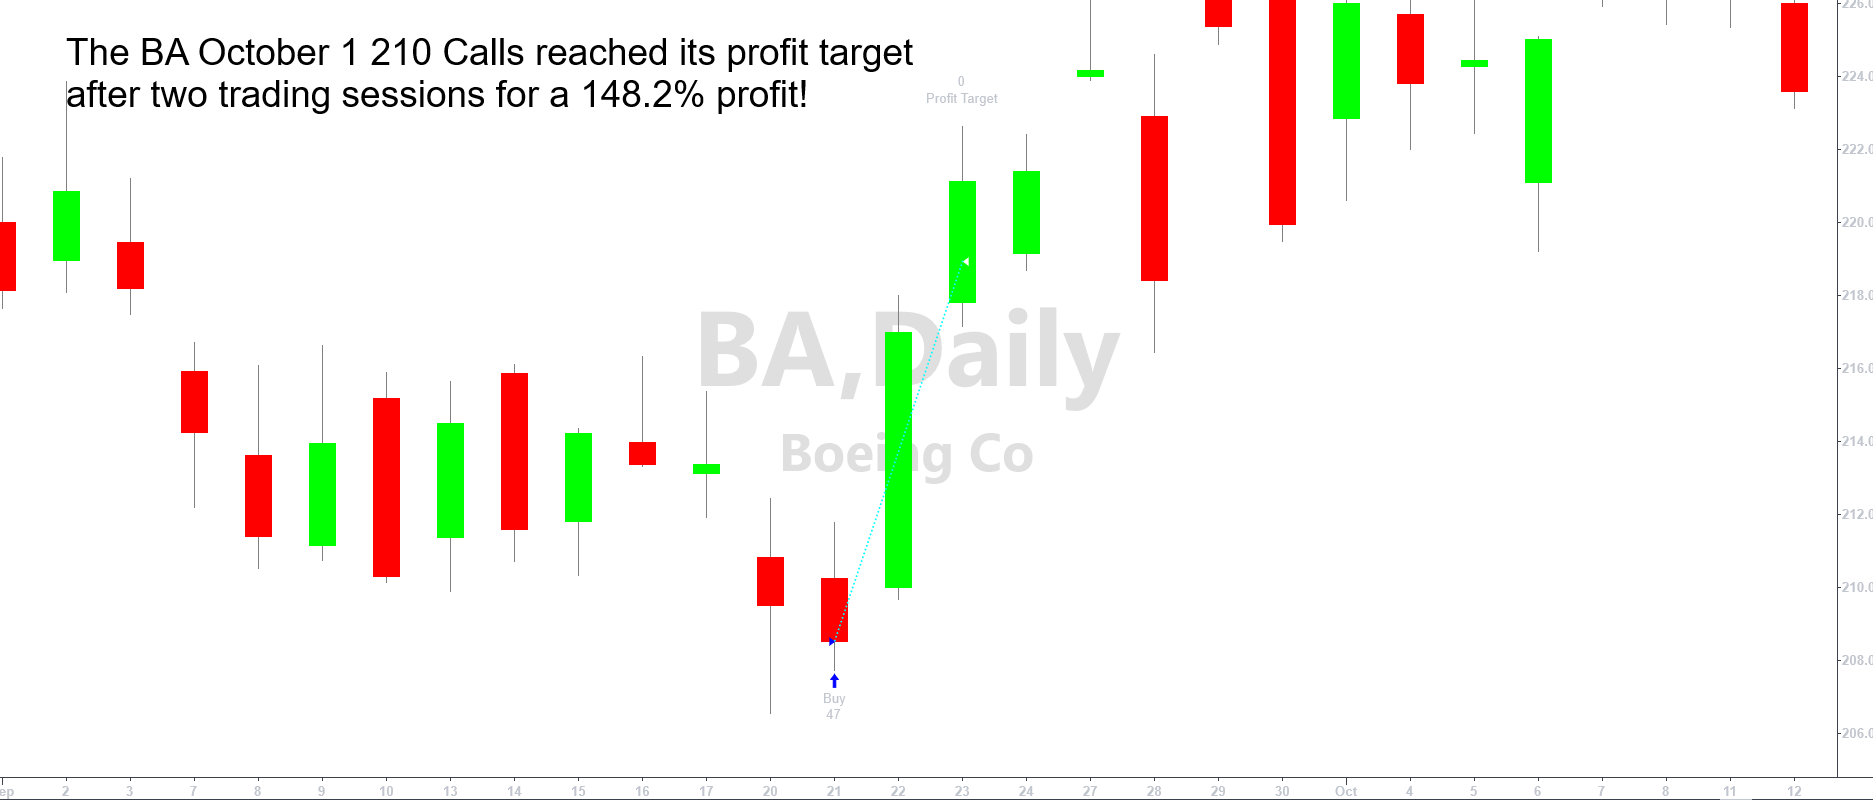
Take the big score on some Boeing (BA) October 1 $210 calls as an example. It took some serious guts to step into a bullish trade at a time it looked like the stock was testing the waters of yet-another meltdown. Our algorithms were right on target though, flashing a buy signal in front of what turned out to be a massive rebound from the aircraft maker’s stock. Two days after we jumped in, we were getting out for more than a 148% profit.
We can’t tell you exactly what we saw brewing at the time — as was noted, some of our interpretation of candlestick charts is proprietary, and we also utilize a handful of trend-based technical tools. The approach clearly worked though.
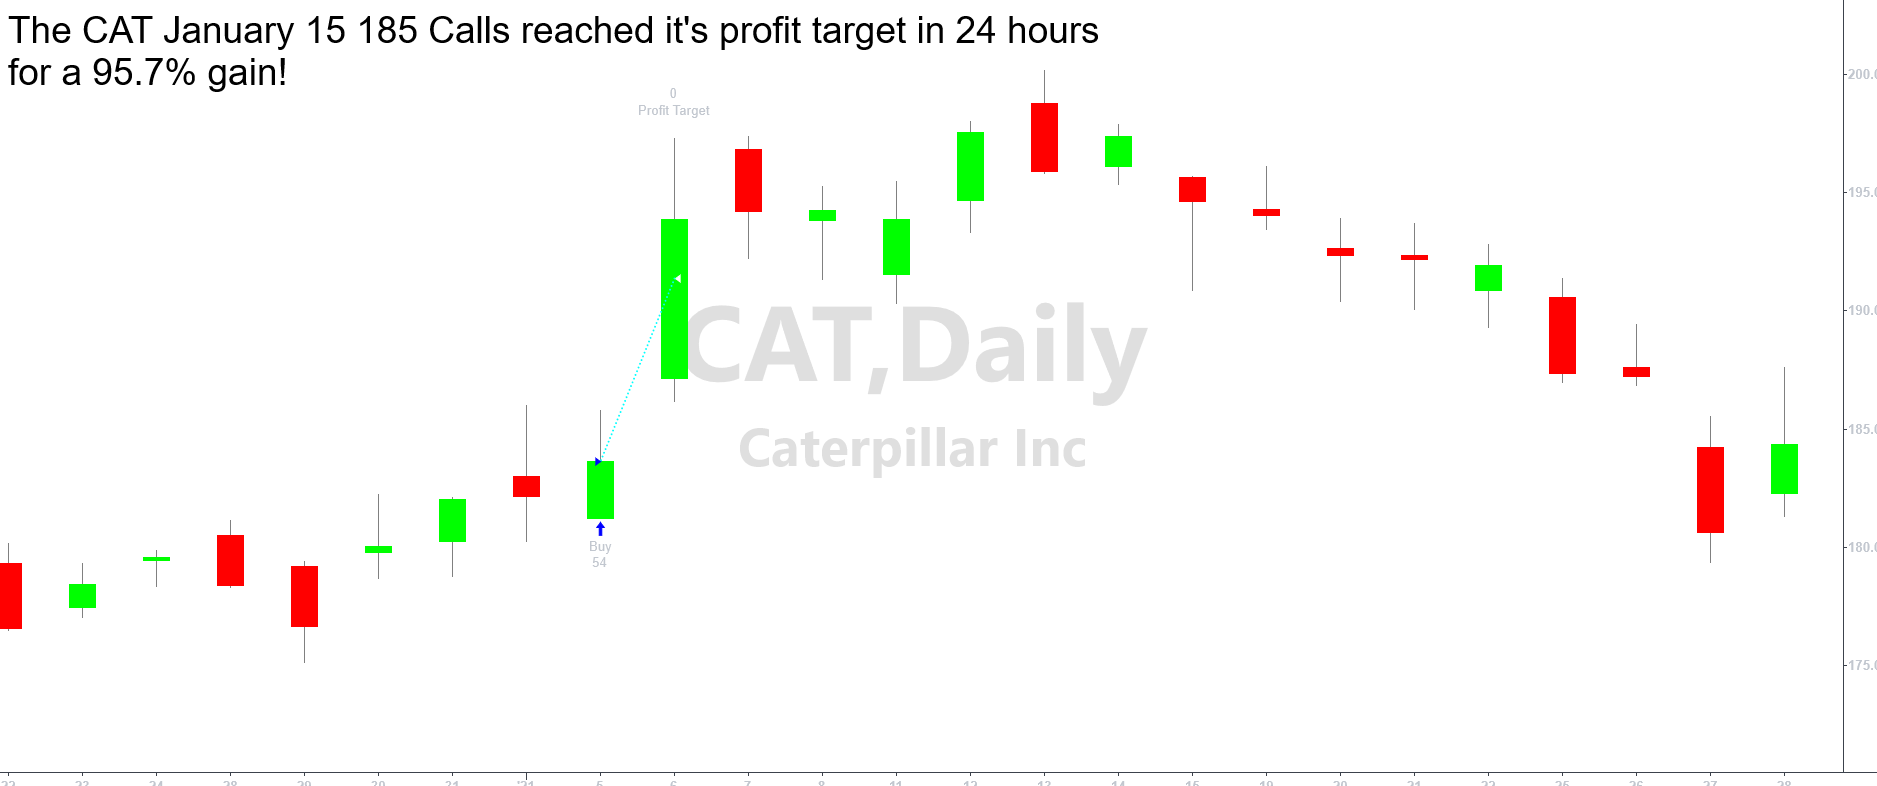
Our Caterpillar (CAT) January 15 $185 call trade also worked out nicely. While this wasn’t a reversal trade, it wasn’t meant to be. In this case the shape of the daily chart’s bars were pointing to a bullish move that was already brewing. When paired with our other analysis, we caught a jump that resulted in a 95.7% gain on the at-the-money option trade.
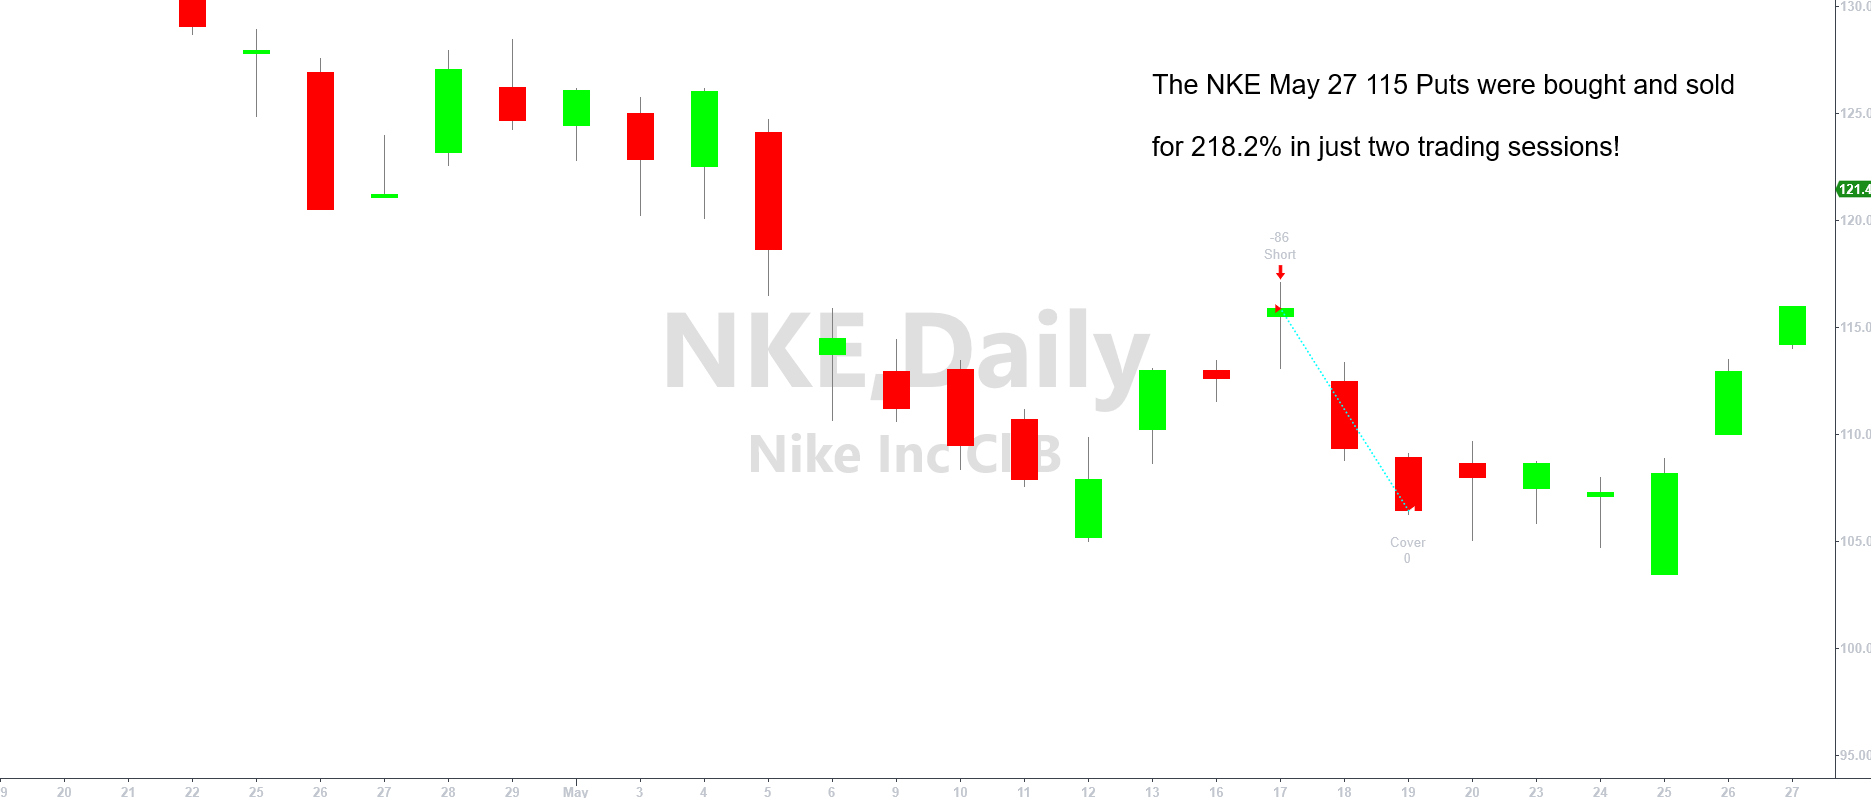
And yes, the approach works in the other direction as well, though our criteria for put trades isn’t a mirror image of the rules we have in place for bullish, call trades. Selloffs and stumbles are rooted in different circumstances than bullish rallies. Namely, they’re usually more violent, and shorter-lived. Whatever the case, the tweak we use to find bearish trades not only means we landed a 218.2% gain in some Nike (NKE) May 27 $115 puts, but ultimately means we’re equipped to find good trades regardless of the market’s environment.
Not every trade works out as well as these did. Some of them lose ground, and a lot of them essentially break-even. That’s ok though. With trade alerts being posted on the order of two to three times per week (or an average of about 10 trades per month), the 2-Day Trader’s approach can help you build significant wealth in a short period of time. The key is to avoid losing big on the trades that don’t move well right out of the gate. With a two-day time limit on any of our suggested option trades though, that doesn’t happen often.
Oh, and if you’re worried this much trading activity will prompt FINRA to flag you as a pattern day trader, don’t sweat. The designation is limited to individuals who habitually place four true day trades — buying and then selling the same stock or similar instrument on the same day — in a five day period. Even waiting until the next day to close out our option trades were exempt you from this tricky categorization. By waiting two full trading days though, the matter never comes close to becoming an issue.
If you’d like to learn more about how the 2-Day Trader alert service can help you use options to build wealth safely and consistently, go here.