Candlesticks, originally developed by Japanese rice trader, Munehisa Homma, can offer a snapshot of price action and are often used as a fundamental tool of technical analysis.
A candlestick in charting is made up of four components, the high, low, open, and close of any given timeframe. Candlesticks can be used to summarize price action on daily, weekly, monthly chart. As well as short time frames such as hourly charts, 30-minute charts, 15-minute, and even one-minute charts. Just like in other aspects of technical analysis, timeframe matters! The longer your time frame, the more confidence you can have in the set up. Using a one-minute chart, it is very likely to get fake outs and find noise; whereas a daily chart can eliminate much of the noise and reduce fake outs.
Inside Day
Consolidation leads to amplification. Simply, an inside bar illustrates quick consolidation prior to a dramatic move. Due to a quick consolidation during a current trend, inside days are typically continuation moves. An inside bar is defined as the second bar, including wicks, trading completely inside the prior bar. The low must be higher than the low of the previous bar and the high must lower than the high of the previous bar thus creating an inside day candle. Inside bars will typically move in the direction of the current trend.
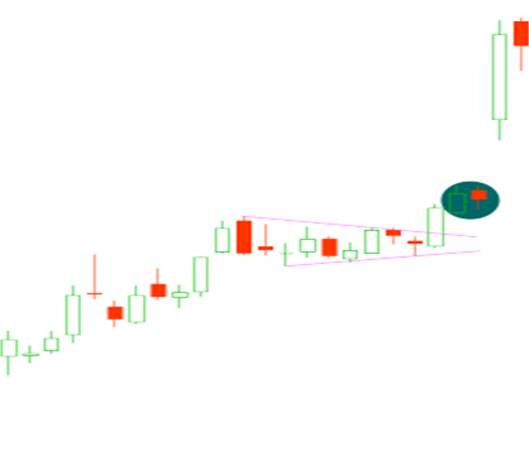
In this chart, we see a current uptrend that is now consolidating above a bull flag chart pattern. Price is now breaking through the flag and we have consolidation above the flag.
This tight consolidation shows that on a day of low volatility, bulls would not allow any budge below the prior days low and that the buyers are still present.
We often hear traders pump the brakes on these types of charts claiming the underlying stock is “too extended.” As a bull, when we get basing and consolidation, it shows that the bulls are upholding the underlying at a specific level and a lack of supply at that current level.
These quick consolidation moves can be very powerful and at 2-Day Trader, we focus on capitalizing on them.
Of course, using a candlestick pattern will prove inconsistent as there are frequent signals daily using this specific candlestick pattern.
At 2-Day Trader, we add additional indicators and go through further filtering to establish the highest probability trades. Inside days are simply a piece of the puzzle.
If you’re interested in further learning or joining the 2-Day Trader team, please click this link.
Join the other thousands of like-minded traders that trust the 2-Day Trader team’s research.